Redefining Shot Quality – Part 1: Why Missed Shots Aren’t All Equal
How Shot Quality Is Measured Today
Current NBA analytics has developed several ways to measure shot quality, with one of the most common being expected effective field goal percentage (xEFG%). This type of metric uses spatial data—where the shot was taken from, the defender’s distance at the time of the shot, and sometimes shot type (layup, floater, catch-and-shoot three, etc.)—to estimate how likely that attempt is to go in. These models are often trained on millions of past shots, so when a player takes a corner three with four feet of space, the system assigns a make probability based on how players historically shoot from that spot with that level of contest. Essentially, these shot quality metrics isolate the shot itself in a vacuum, focusing only on location, type, and defensive proximity.
The limitation of this approach is that it strips away the broader context surrounding the shot. For example, the current metrics don’t consider whether the possession might generate a better look if the shooter had passed, or whether rebounding positioning makes a missed attempt more “valuable” than the percentage suggests. Similarly, while they incorporate contest level, they don’t account for fatigue, momentum, or psychological aspects of the game that influence outcomes. By treating every corner three with four feet of space as equal, they ignore player identity—Steph Curry and a below-average shooter are both assigned the same probability, even though the real expected outcome is drastically different.
My Vision
The vision for this project is to build a contextual shot quality model that moves beyond treating shots as static events. Instead of looking only at the attempt’s geometry and defender proximity, the new metric would evaluate the shot within the ecosystem of the game: rebound opportunities, clock pressure, team alternatives, shooter skill, and player condition. By doing so, we can quantify the true quality of a possession-ending decision, not just the isolated likelihood of a ball going through the hoop.
The first aspect I’ll be looking at is how offensive rebounding probability should be folded into the evaluation of shot quality. A rushed midrange attempt might traditionally be labeled “low quality,” but if a dominant rebounder is positioned under the rim, the overall value of the possession is higher than the shot alone suggests. This post will specifically focus on that dimension of the project, while the next post will turn to player effectiveness: factors such as teammate availability, player fatigue, and momentum. The final stage of the project will bring in game flow considerations like the shot clock, score differential, and other contextual elements I find relevant.
Offensive Rebounding
In the traditional way we think about shot quality, a miss is a negative outcome, full stop. But in reality, some missed shots generate additional value by setting up offensive rebounding opportunities, which can extend the possession and ultimately lead to more points. This nuance matters, because a “bad” shot in one sense might actually be “good” when viewed in the broader context of what happens after the ball leaves the shooter’s hands.
The numbers make this point very clear. During the 2024–2025 NBA regular season, teams averaged 1.27 points per possession following an offensive rebound. That figure is higher than the 1.15 points per possession teams generated on standard possessions overall. In other words, a second-chance possession is not just another opportunity to score, it’s actually more efficient than the first attempt. This makes sense intuitively: after an offensive rebound, the defense is usually scrambled, players are out of position, and quick put-backs or open threes often become available.
To investigate this idea further, I set out to build a metric that would calculate the expected offensive rebound value of every shot attempt. Unfortunately, only one full season of NBA tracking data is publicly available: 2015–2016. While it’s somewhat dated, it still offers millions of data points to analyze every single missed shot. In building the model, I wanted to account for several key factors. The location of the shooter matters, since long shots tend to produce long rebounds and may favor perimeter players crashing the glass, the offensive formation, and the defensive formation.
Quantifying Offensive and Defensive Formations
When a viewer watches a shot attempt, they can quite easily diagnose which team is better positioned to grab a rebound. This is a bit trickier to explain numerically, however. Lets look at this corner 3 by the Phoenix Suns’ Mirza Teletovic, playing the Warriors on December 16, 2015, below:
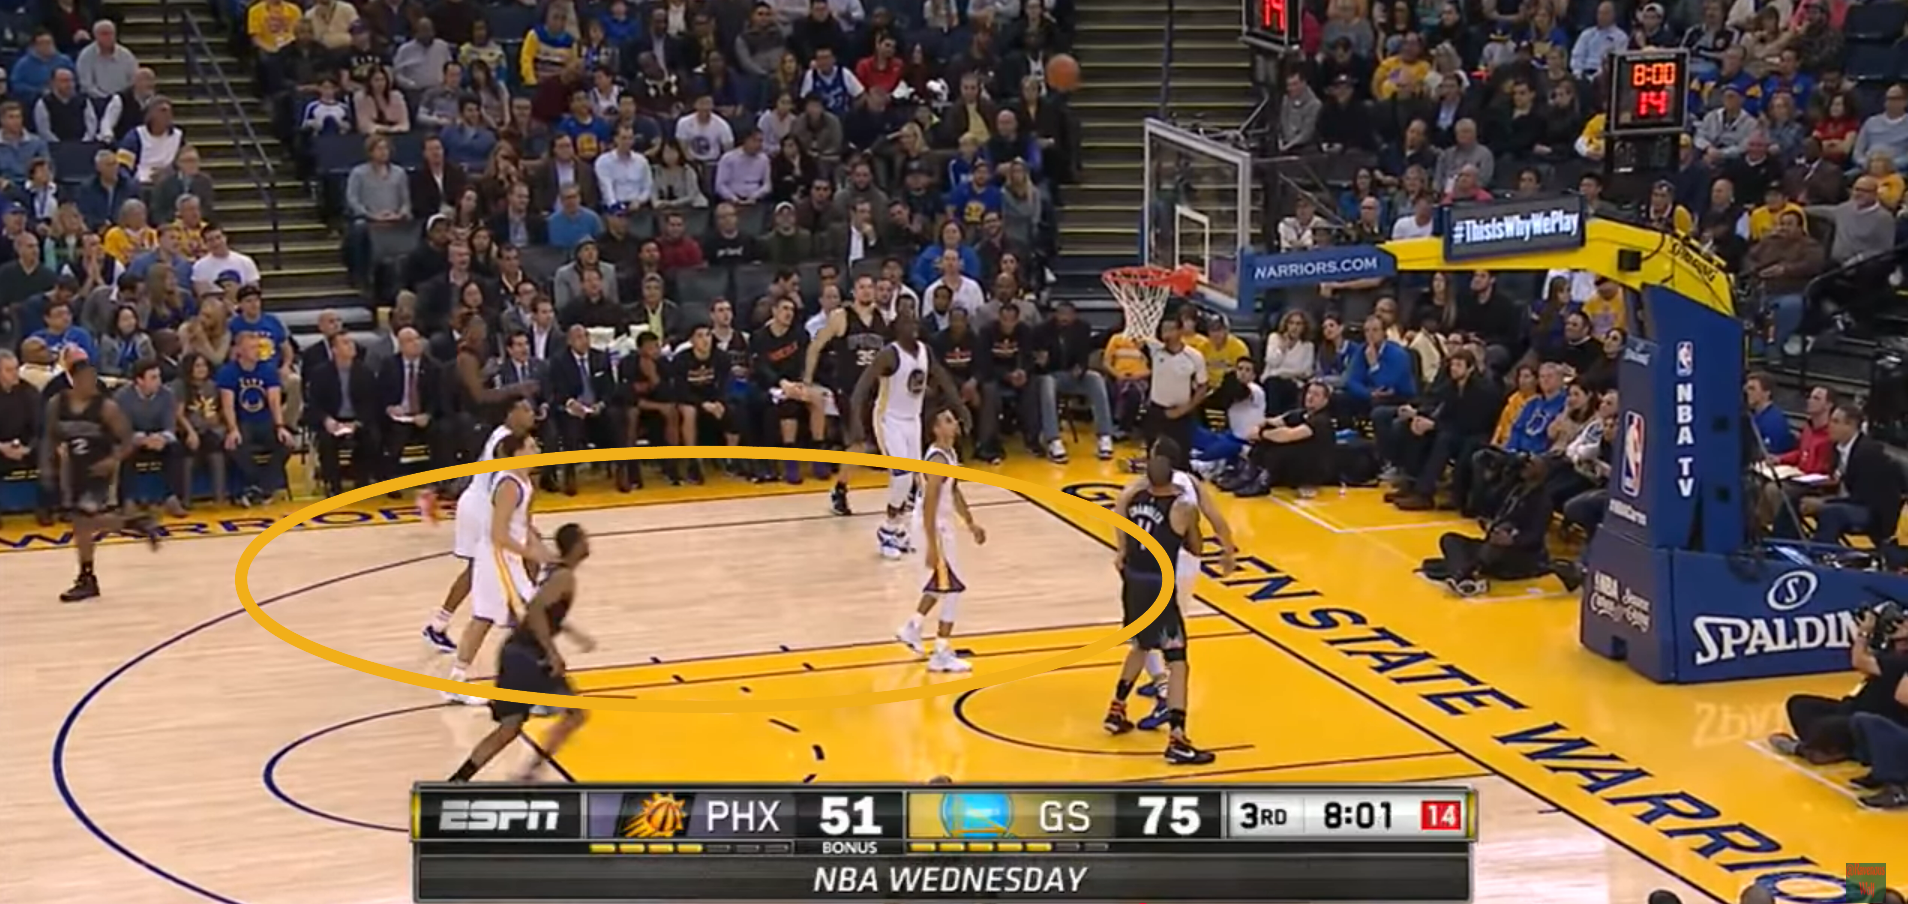
If you look at the still frame on the right, taken as the ball is approaching the hoop, you’ll notice that all five Golden State Warriors players are clustered tightly in the same small area. I highlighted this zone with a yellow oval, which, to the eye, seems like the only region where Golden State would have a good chance at securing the rebound. But that oval represents just a fraction of the total rebounding space. Any rebound that caroms toward the half of the court closer to the camera looks almost certain to fall to the Suns. Even in the paint, Phoenix holds the advantage: Tyson Chandler has an advantageous position against the smaller Andrew Bogut directly under the rim, while T.J. Warren is battling both Steph Curry and Klay Thompson, two smaller guards, in the upper half of the key. Taken together, these factors make it feel obvious that Phoenix is favored to secure the rebound, which is exactly what happened. The challenge is quantifying these factors that seem obvious to the eye.
Voronoi
I’ve become increasingly interested in the application of Voronoi area across different sports as a way to quantify space and control. In a previous project, I used Voronoi diagrams to measure catch radius and separation for wide receivers against defenders in the NFL. For this project, I applied the same concept to basketball, using Voronoi area to capture how much space each team effectively “owns” around the rim when a shot goes up.
Let’s look at the same play that we were looking at above. The diagram below shows the Voronoi area that each player on the court owns at the time of the shot.

Some of the ideas that I mentioned above are more clearly quantified now. Each Warriors player owns quite a small area, since they are so close to each other. TJ Warren and Tyson Chandler own so much area, that they are not even near, because there are no Warriors players nearby. Out of the 2350 square feel available in the half court, the Suns owned 1135.4 sq ft while the Warriors owned 472.12 sq ft, at the time of the shot.
I used the instance of the shot being taken because the final goal is to evaluate shot quality at the time of the shot.
Applying this concept to every missed shots from the 2015-2016 season, I engineered 12 potential features to use to predict Offensive Rebound probability:
Shooter Location (x and y)
Offensive and Defensive Half Court Voronoi Area
Offensive and Defensive Paint Voronoi Area
Offensive and Defensive Players in Paint
Offensive and Defensive Tallest Paint Player Height
Offensive and Defensive Average Paint Player Height
Modeling
To choose which features I would use in my final model, I looked at correlation metrics, looked at feature significance while building my model, and used my basketball knowledge.

The correlation graph revealed a few things.
A shooter’s x-coordinate was much more telling than their y-coordinate. This made sense to me because the x value measures how far along the court the shooter is, basically, how close they are to the basket which directly affects offensive rebound probability. As the graph shows the further the shooter is from the basket, the less likely the chance of an offensive rebound.
The number of player’s each team has in the paint is much more telling than how much Voronoi area they own in the paint. This could be because in a small, crowded area like the paint, “space controlled” may not be very telling.
For those reasons, I excluded those 3 features from my model.
The random forest model performed at an 84% accuracy with the following statistics:

Findings
Although the main purpose of this metric is to use it to quantify overall shot quality, I still wanted to derive some interesting findings with the 2015-2016 season tracking data. I looked at this in 2 ways:
Which teams and players outperformed their expected rebound probabilities?

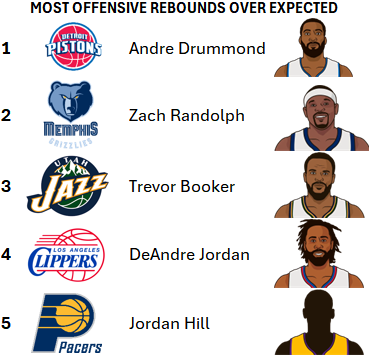
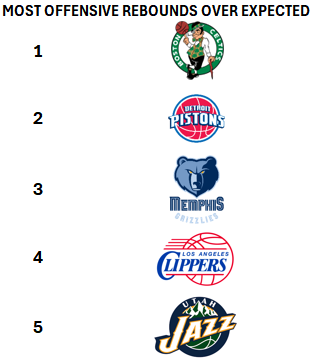
Looking at this list, you’ll notice some expected names, prolific rebounders who consistently grab boards. The most interesting takeaway, however, is that the 2015–2016 Celtics led in rebounds over expected without having any individual in the top 5 or a standout rebounder in general. Their team was structured so that many players contributed to rebounding: eight Celtics averaged at least one offensive rebound per game. In contrast, the second-place Pistons had only four players in that category, with Andre Drummond accounting for nearly 40% of the team’s offensive rebounds.
Which teams and players took shots with the highest expected rebound probability?


Looking at the 10 shooters with the highest average offensive rebound probability per shot, it’s no surprise to see the Knicks and Lakers also at the top of the equivalent team list. This raised an interesting question: are these players ranked highly because of their own decision-making, or because their teams are particularly well-schemed for offensive rebounding?
While teams like the Lakers, Pelicans, Pacers, and Knicks were fairly average in offensive rebounding, the Atlanta Hawks stand out. They ranked 30th in Offensive Rebounding Rate, 30th in Offensive Rebounds per Game, 29th in Contested Offensive Rebounds per Game, and 28th in Offensive Rebound Chances, by all measures, one of the league’s weakest offensive rebounding teams. Yet, Mike Muscala still tops the individual list. Despite averaging fewer than three field goal attempts per game, he consistently took shots that carried strong offensive rebound probability.
Looking Ahead
Part 2 of this project will focus on player effectiveness, with the goal of understanding whether certain players consistently create higher-value possessions through a combination of smart shot selection, awareness of their teammates’ positioning, and the ability to manage factors like fatigue and momentum.